Equal Highs: Explained Simply
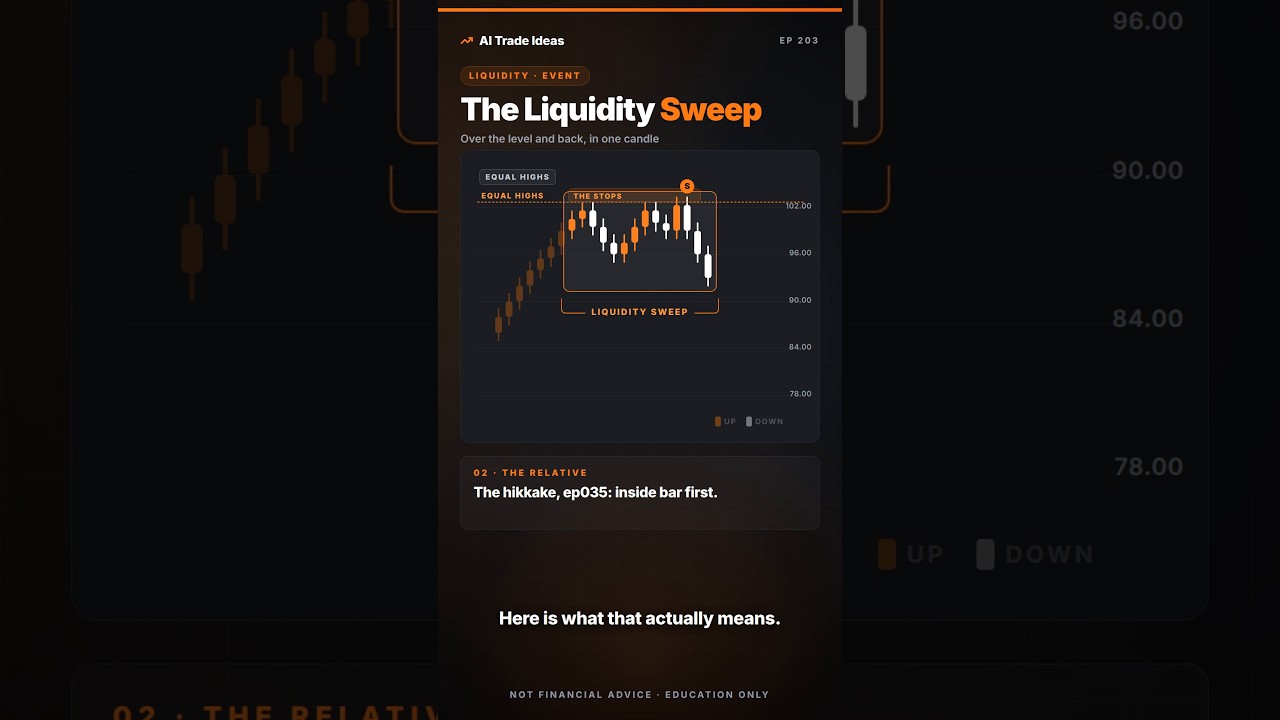
Equal highs are a visible price level that acts as an address rather than a barrier. Traders recognize the level because price has touched it more than once at roughly the same height, yet the level itself carries no inherent strength until it is tested again.
What the pattern is
Equal highs form when two or more swing highs reach almost identical prices. The market treats that price as a reference point, not necessarily as resistance. The repeated touches create a cluster of resting orders, which later participants can use to gauge where liquidity sits.
What forms it
The level becomes defined only after price has revisited the same high area and left a second matching peak. Until that second touch occurs, the first high remains just a single data point. Once the second peak aligns, the market has effectively labeled the price as an address worth watching.
What confirms it
Confirmation comes from three conditions. First, the level must be visible on the chart without extra lines or indicators. Second, the equality of the highs must already be established by prior price action. Third, the level’s importance is judged by its location on the chart, not by the direction price is traveling when it arrives.
How it fails
The common error is assuming that because the level is obvious it must be reliable. When many traders can see the same clean highs, the same liquidity sits above or below them. If price reaches the level and sweeps those orders without reversing, the equal-high address is simply cleared and no longer functions as a reference point.