The trading school that walks every trade with you.
From the headline you read before the open to the bias you set, the trade you take and the review once it hits stop or target — the platform and Otus are beside you at every step, whether it's your first chart or your thousandth.

Wherever you are, it starts where you are
The same school for a first chart and a ten-year habit. Each part opens when the one before it is done.
Start at the candle.
What one bar says, what an order is, where price reacts. Otus explains every term the moment you meet it, and a short quiz shows what stuck.
Put names to what you already see.
Candlestick and chart patterns, liquidity and indicators — defined precisely, with the published numbers behind them where numbers exist.
Keep your process honest.
Mark up live charts and have them checked against the lesson, log every trade, and review each outcome against the plan you wrote before it.
A coach who has read every lesson
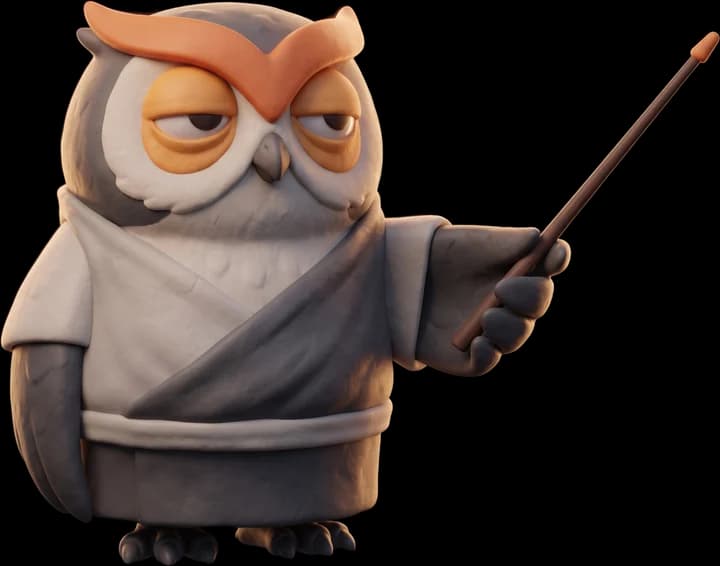
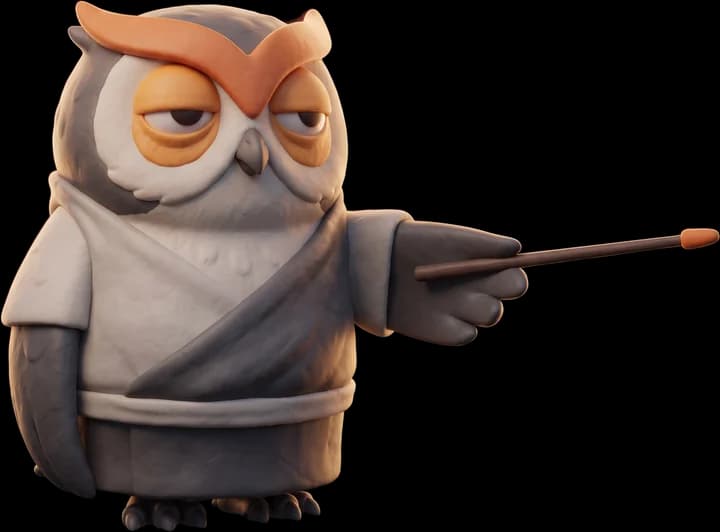
He is in the videos, beside every chapter, in the browser extension and in the corner of every page.

Otus teaches in the syllabus's own words. He doesn't hand out calls — he asks what you see, tells you what the lesson says about it, and shows you where to look again.
Ask about any chart, any term, any headline — at any hour, in plain words.
Your quiz and written answers, against what the lesson actually taught.
Your chart markup in Chart Practice, check by check, with the chapter to reread.
Try an interactive markup testYour stop sits under the 2,396 swing low — the price where this idea is wrong. Size from that distance, not from how much you'd like to make.
Entry 2,413 to stop 2,393 is 20 points. That is the number your position size comes from.
Chapter · A stop goes beyond the level, not on it — Risk before entry · Part 04
8 parts, one path
From reading a single candle to running one idea end to end. Each part has a badge of its own.
- Part 01 · 5 modules
Reading price
What one bar says, what a market and an order are, where price reacts, and when a trend is still a trend.
- Part 02 · 6 modules
Candlestick patterns
The named shapes — one candle, two, three, the continuations — what each records, and how to check one yourself.
- Part 03 · 2 modules
The clock

Why the same move means more at one hour than another, and the shape of a trading week.
- Part 04 · 3 modules
Risk and records

Size from the stop, think in R, record every outcome the same way, and trade inside limits.
- Part 05 · 5 modules
Chart patterns

Heads and shoulders, double tops, triangles, flags and cups — the line that confirms each, and what a failed one records.
- Part 06 · 4 modules
Liquidity

Why a pattern's own line is where stops gather, what a sweep of it records, gaps and blocks defined precisely — and what nobody has measured.
- Part 07 · 5 modules
Indicators

RSI, MACD, moving averages, bands, volume and VWAP as the arithmetic they are — what each lags and cannot tell you.
- Part 08 · 3 modules
Putting it to work

Read a release, read an analysis as a plan, and run one idea end to end.
Every chapter ends with you doing it
Quizzes, written answers and chart exercises — and a game board that keeps count.
Practise the module on a real chart
Finish a module, open its exercise, draw your levels and patterns on live data — and lock it for Otus to mark. Each check comes back as holds, missing or wrong, with the chapter it came from.
A reason to come back tomorrow


 and ranks up to Desk Veteran
What you apply it with
The same platform that teaches the reading does the work around the trade — before, during and after.
Before the open
Market insight: a briefing for each session, the day’s movers and the headlines that matter.
At the chart
Upload a chart and get a structured trade idea in under a minute — bias, entry, stop and targets.
After the exit
Trade Outcome Review: what price actually did, drawn on our own candles, and why it played out that way.
While you read→
The browser extension: highlight any passage and ask Otus about it, without leaving the page. Free to try for 7 days.
A chart in, a plan out.
- 01Upload Chart
Drop in a screenshot of any price chart - 02AI Analysis
Our AI analyzes patterns, support/resistance, and trends - 03Get Trade Ideas
Receive entry, SL, targets, and risk/reward ratio - 04Trade Outcome Review
Later, the real candles are drawn over your levels
An idea is only half the picture
Once a trade settles, see what the price did — entry, stop and targets drawn on the candles, by the same renderer that draws the result posted to Telegram.
Watch the desk apply it, trade by trade
A private room, capped in size, where every trade the desk takes goes out live — and a weekly recap of each one, with its result and the reasoning behind it, that every account can read.
Asked often
Quick answers. The rest are on the support page.
How do I create an account?
To create an account, visit the "Sign Up" page, enter your email address, create a secure password, and follow the instructions to verify your email. Once verified, you’ll have full access to the platform.
What markets/assets do you support?
We currently support stocks, forex, cryptocurrency, commodities, and more. Please check our platform for the most up-to-date list of supported markets.
Can I cancel my account / subscription?
Yes. To cancel your subscription or delete your account, please visit the account settings page or contact customer support.
How do I contact support?
If you have any questions or need assistance, you can contact our support.
What is AI Trade Ideas?
AI Trade Ideas is an AI-powered platform that provides real-time trade and chart analysis to help traders make informed decisions. Our system generates actionable insights in seconds, assisting with various asset classes, including stocks, forex, crypto, indices, and more.
What happens if I forget my password?
If you forget your password, simply click on the “Forgot Password” link on the login page. Enter your registered email address, and we'll send you instructions to reset your password.