The Doji: Pause or Reversal?
A doji forms when open and close sit at virtually the same price, leaving a thin or nonexistent body between two wicks. It signals that neither buyers nor sellers gained ground during that period.
What the pattern is
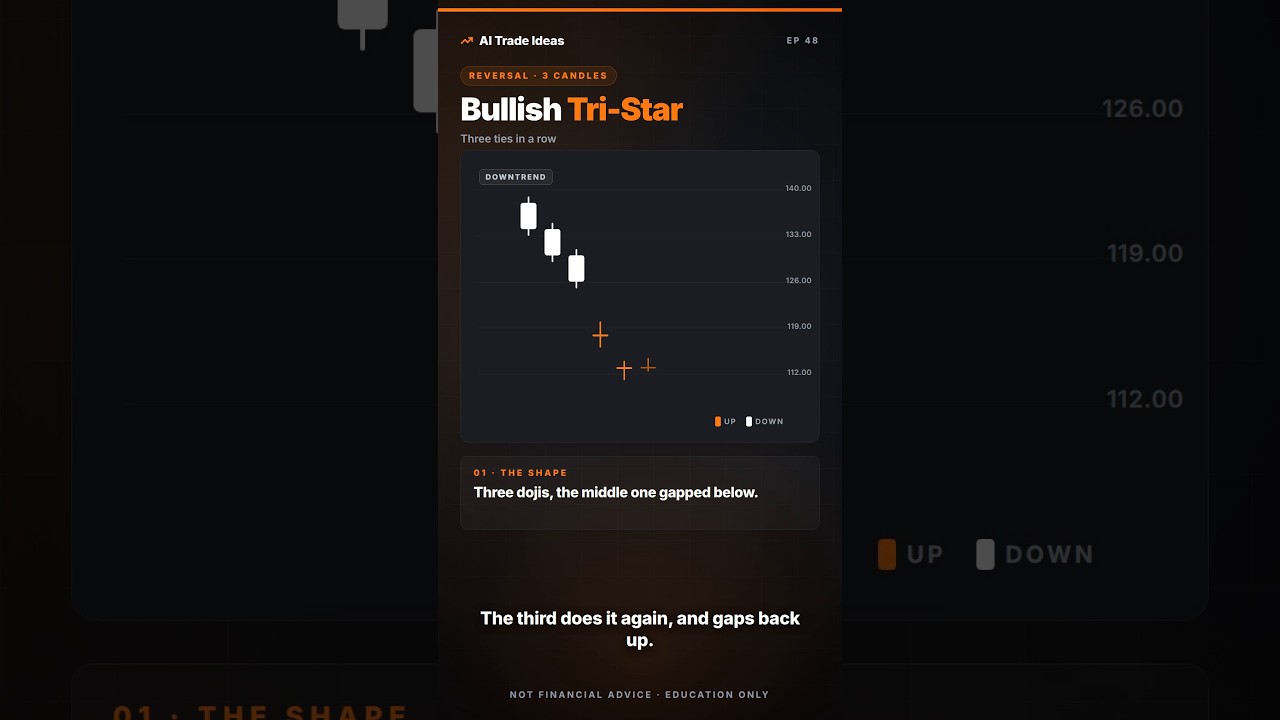
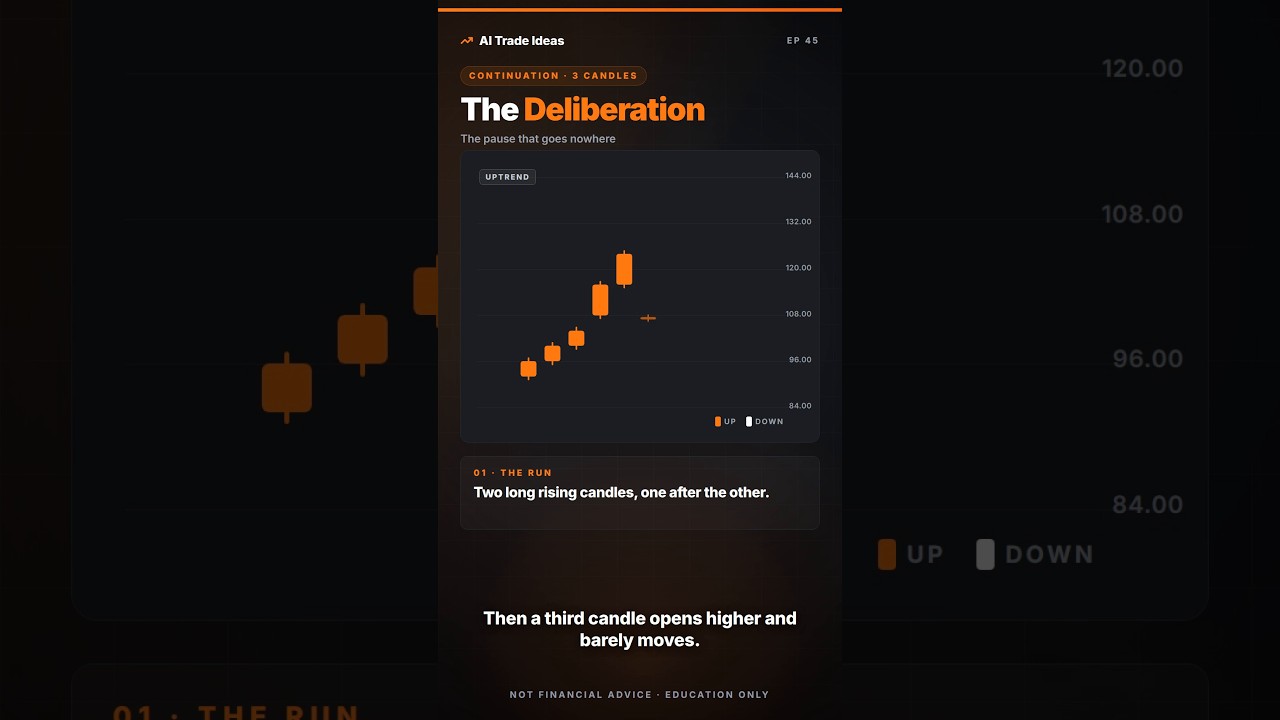
The doji is a single-candle pause that appears after a sustained directional move. Its small body shows equilibrium: the session opened and closed near the same level, yet price explored both higher and lower territory before settling back where it began. The pattern itself carries no directional bias; it simply marks a momentary standoff.
What forms it
An extended advance or decline sets the stage. After many consecutive bars pushing in one direction, buying or selling pressure reaches a temporary balance. The resulting candle has open and close prices that are equal or nearly equal, regardless of the length of the wicks. The preceding trend, not the candle’s size, gives the doji its relevance.
What confirms it
Confirmation arrives only with the candle that follows. If that bar closes decisively above the doji high after an up-move, or below the doji low after a down-move, the market has chosen a direction. Until that next candle prints, the doji remains neutral and offers no trading signal.
How it fails
Treating the doji itself as an entry point ignores its message of indecision. Without a clear follow-through bar, price can drift sideways or reverse without warning. Placing trades solely on the appearance of the doji therefore lacks confirmation and frequently leads to positions taken against the eventual resolution.