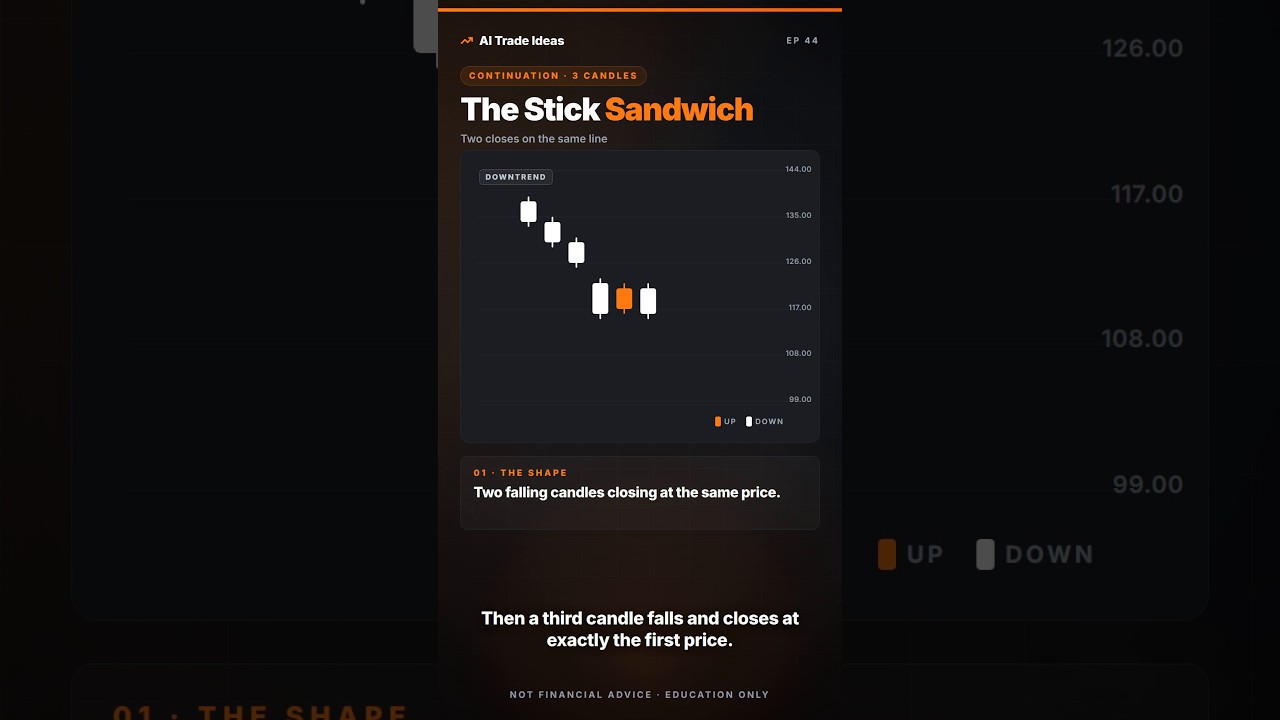
MASTER 20 Candlestick Patterns in 25 Minutes
A candlestick pattern is a shape formed by one or more candles that traders use to read what buyers and sellers have just done. The video walks through twenty of these shapes, one at a time, and shows the three questions that decide whether any of them should be noticed.
What the pattern is
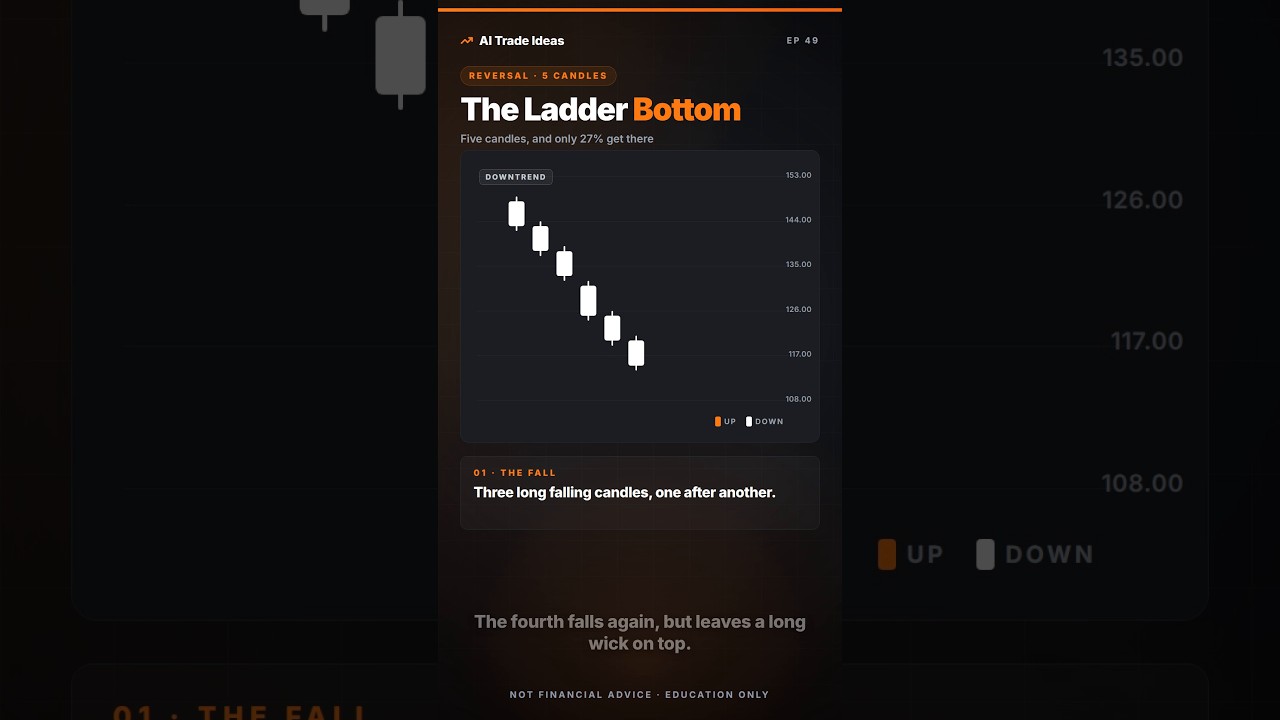
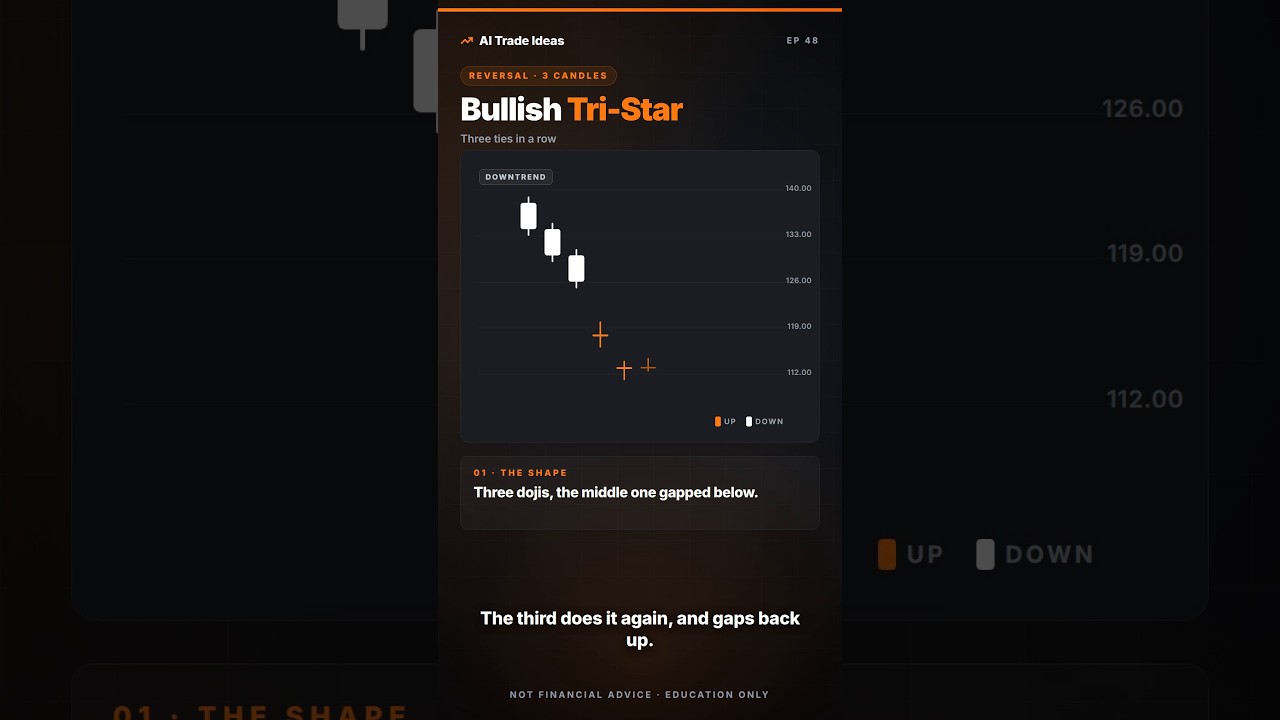
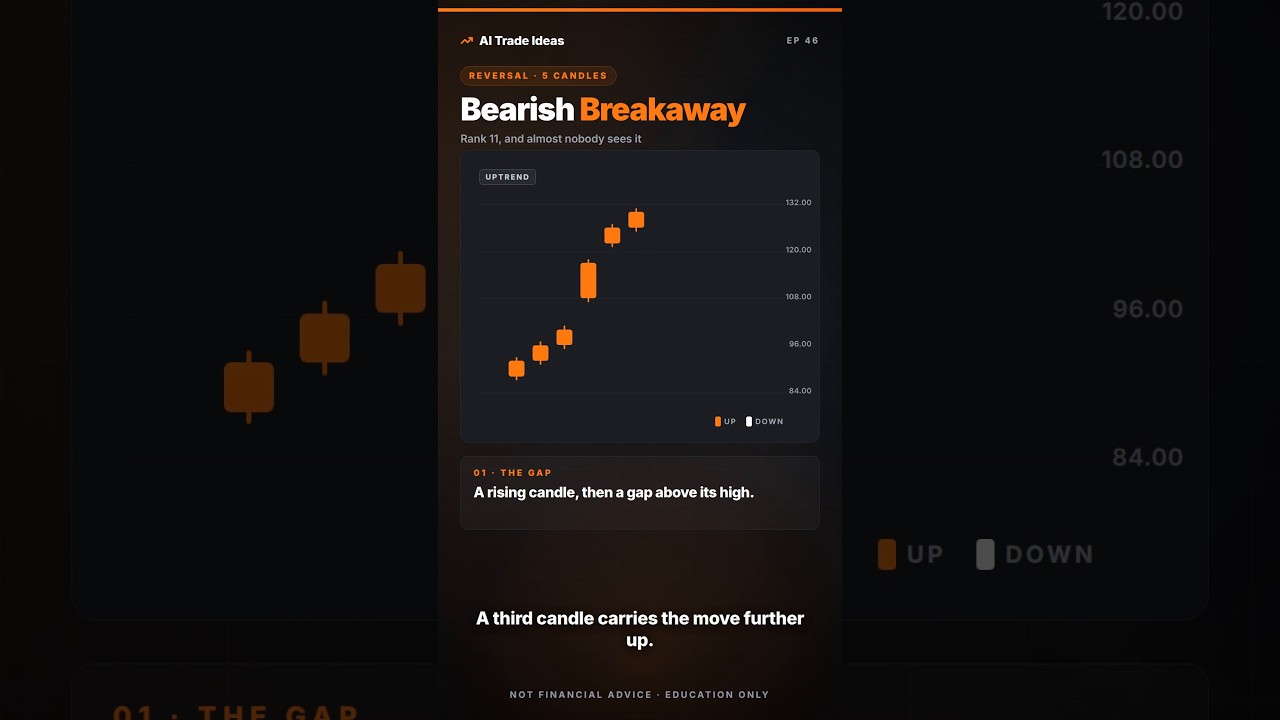
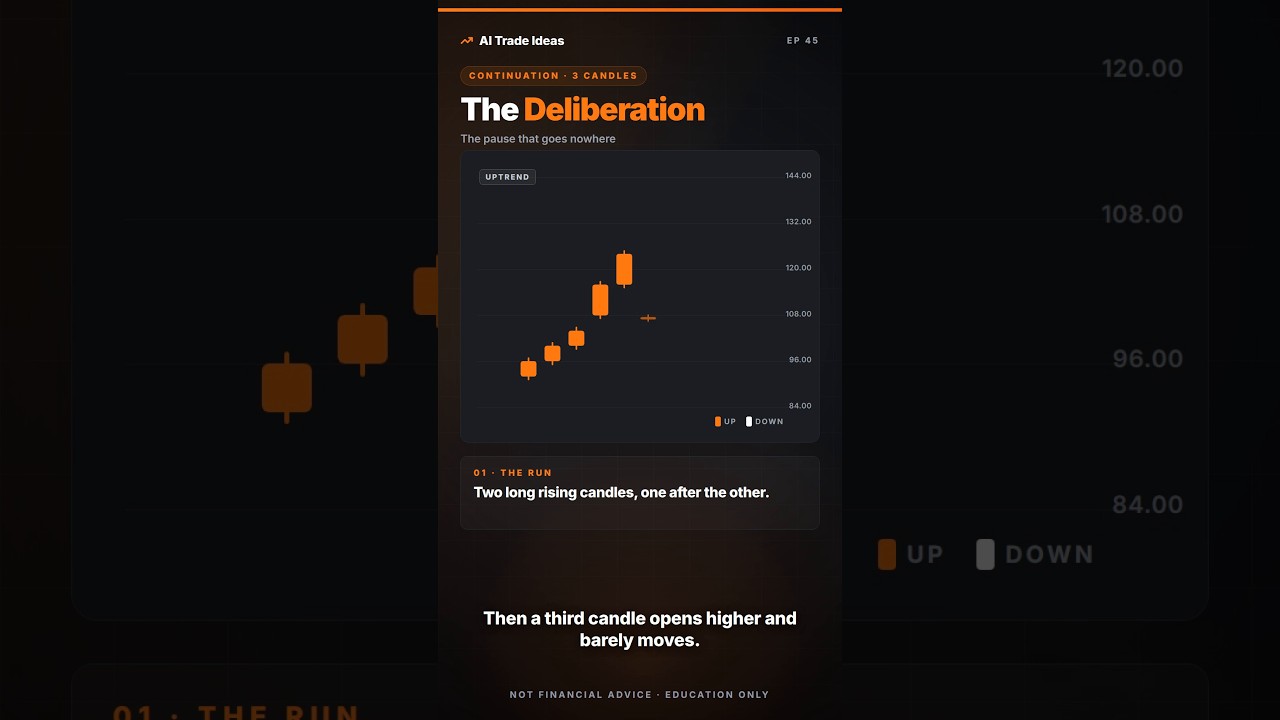
Each pattern is introduced by its name and the exact arrangement of open, high, low, and close that creates it. A Bullish Engulfing is a small candle followed by a larger candle whose body covers the previous candle completely. A Hammer is a single candle with a small body at the top and a long lower wick. The Morning Star is a three-candle sequence: a long bearish candle, a small-bodied candle that gaps lower, and a long bullish candle that closes well into the first candle’s body. The same level of detail is given for every other pattern, from the Doji through the Three Outside Up.
What forms it
The video explains the market action that produces each shape. A Shooting Star forms when price rallies sharply during the session but sellers push it back near the open by the close, leaving a long upper wick. A Bearish Engulfing forms when buyers are overtaken by sellers who drive price through the prior candle’s range and close below it. A Hanging Man appears after an up-move when sellers test lower prices yet fail to hold them, leaving a long lower wick. Each pattern is shown as the direct result of buyers and sellers testing and then accepting or rejecting a price level.
What confirms it
Three questions are repeated for every pattern: where did it happen, what came before it, and did the next candle agree. Location matters because the same shape can appear in different contexts. Preceding price action shows whether the pattern is arriving after an extended move or in the middle of a range. The following candle is checked to see whether it respects or rejects the pattern’s implication. The video stresses that without answers to these three questions the shape itself carries no weight.
How it fails
The video points out the common mistake of treating the pattern as a standalone signal. A pattern that forms in the wrong place, after the wrong move, or is immediately contradicted by the next candle is treated as invalid. The same shape that looks identical on the chart can be ignored once the three questions are asked and the answers do not line up.