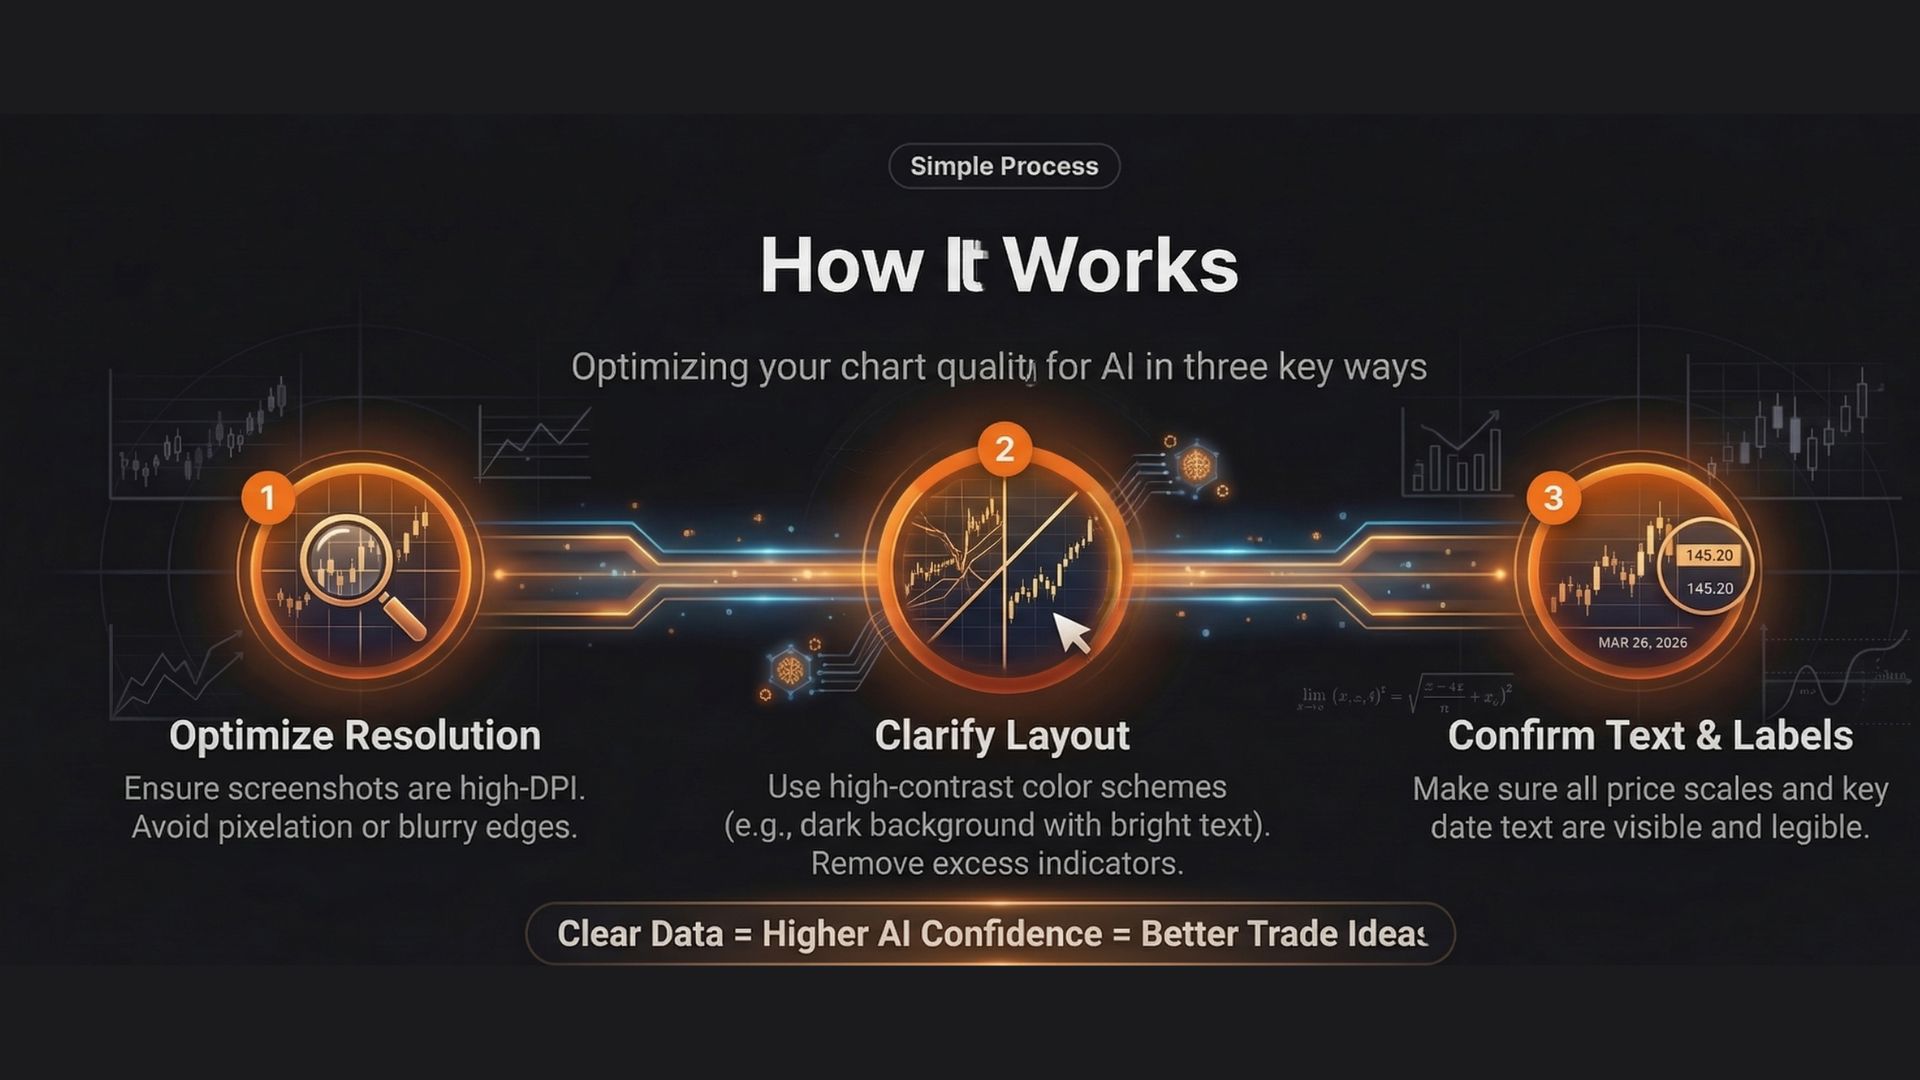
Editorial
Enhancing Your Trading Insights: How to Upload Clearer Charts to AI Trade Ideas
However, to truly unlock the full potential of our collective intelligence and ensure everyone can act on the analysis, we have some important tips for uploading your charts.
Hey AI Trade Ideas members!
We've been incredibly impressed with the quality of technical analysis being shared in our community. Every day, the insights are sharper and the calls are more precise.
However, to truly unlock the full potential of our collective intelligence and ensure everyone can act on the analysis, we have some important tips for uploading your charts. A central part of our platform is the ability for others (and our algorithms!) to accurately read the market data you're analyzing.
Recently, we've noticed an uptick in chart submissions that, while insightful, are difficult to read. The primary issue is the visibility of essential numbers. For example, a shared chart might look like this:
This chart has great information, but what's the scale? Where are the key support and resistance levels? The lack of clear axis labels makes it hard to quickly grasp the market structure.
Here's how we can make our charts better:
1. Show the Numbers Correctly!
The most crucial element of a financial chart, besides the price action itself, is the price and time scale. Without these, a chart is just a series of shapes.
Our best advice? Zoom in. A well-zoomed-in chart that clearly displays the price grid and recent high/low levels is vastly more useful than a wide-angle view that covers months but has tiny, unreadable axis numbers. Focus on the relevant price action. A closer view is much easier for our members and our automated systems to process.
Ideally, frame your chart to show the current price clearly. By ensuring the current price is a primary focal point, you instantly give context to all other indicators on the chart. Our algorithms and fellow traders need this starting point.
Here is an example of what we are looking for:
This image is significantly zoomed-in to the most recent price action, with the vertical price axis clearly displaying legible numbers at appropriate intervals (e.g., in increments of 10 or 20) and the horizontal time axis clearly showing the time of day at short intervals (e.g., hour by hour). The overall blank space is minimized, and the current price is prominent. All header and footer text from image_0.png is present and perfectly legible.
See the difference? This zoomed-in view, which is the Gold Spot instrument from the earlier example, now shows clear price levels (e.g., 4340, 4360, etc.) and time intervals. This makes the analysis instantly digestible and actionable.
2. Indicators: They're Great, But Optional!
A lot of our traders ask if they should add indicators. The short answer: Only if they add value.
While a clean price action chart is powerful, indicators can help to confirm a trend or signal a reversal, which is exactly what we're looking for. Feel free to add popular tools like:
Moving Averages: Such as a 200 EMA or 50 EMA, to quickly show the long and short-term trend.
Oscillators: Like RSI or MACD, to identify overbought/oversold conditions or momentum shifts.
However, they are not a requirement. We value a perfectly framed, plain candlestick chart over a cluttered chart with 10 unreadable indicators. Focus on presenting a clean and readable visual argument.
A Final Tip on Composition
Your chart should be balanced. Aim for a composition where the price action fills most of the frame without hitting the edges. Avoid huge expanses of empty space above or below your chart data, as that simply squashes the relevant information. By adjusting your scaling, you can ensure a professional-looking and informative chart.
We are so excited by the growth and depth of the AI Trade Ideas community. By adopting these simple chart-sharing practices, we can make our analysis clearer, more accessible, and more profitable for everyone.
Keep up the great work, and we look forward to seeing your clearer, more focused charts!
Happy trading,
The AI Trade Ideas Team