Editorial
AI vs. Traditional Indicators: Why Speed is King in the Markets
Imagine you're driving a car by looking solely at the rearview mirror. You'd see where you've been, but not where you're going or the obstacles immediately ahead. That's precisely the challenge with lagging indicators

AI vs. Traditional Indicators: Why Speed is King in the Markets
For decades, technical analysis has been the bedrock of trading. The Relative Strength Index (RSI), Moving Average Convergence Divergence (MACD), and Stochastic Oscillator have been staple tools for countless traders. They promise insights, identify overbought/oversold conditions, and signal potential reversals.
But here’s the stark truth: they are all inherently lagging indicators.
By their very nature, these traditional tools rely on historical price data to generate their signals. This means that by the time an RSI confirms an overbought condition or a MACD crosses, the "Smart Money" has often already made its move, and retail traders are left chasing the tail end of a trend.
The Problem with Lag: Missing the Opportunity
Imagine you're driving a car by looking solely at the rearview mirror. You'd see where you've been, but not where you're going or the obstacles immediately ahead. That's precisely the challenge with lagging indicators:
RSI: Calculates momentum based on past gains and losses. It tells you a stock was overbought, not necessarily when it will reverse.
MACD: Derived from moving averages, it smooths out price action, but that smoothing introduces delay.
Moving Averages: The ultimate lagging indicator, literally showing the average price over a past period.
In fast-moving markets like Gold, NASDAQ, or US30, a few seconds of delay can be the difference between a profitable entry and a painful stop-out.
The AI Advantage: Predictive & Reactive
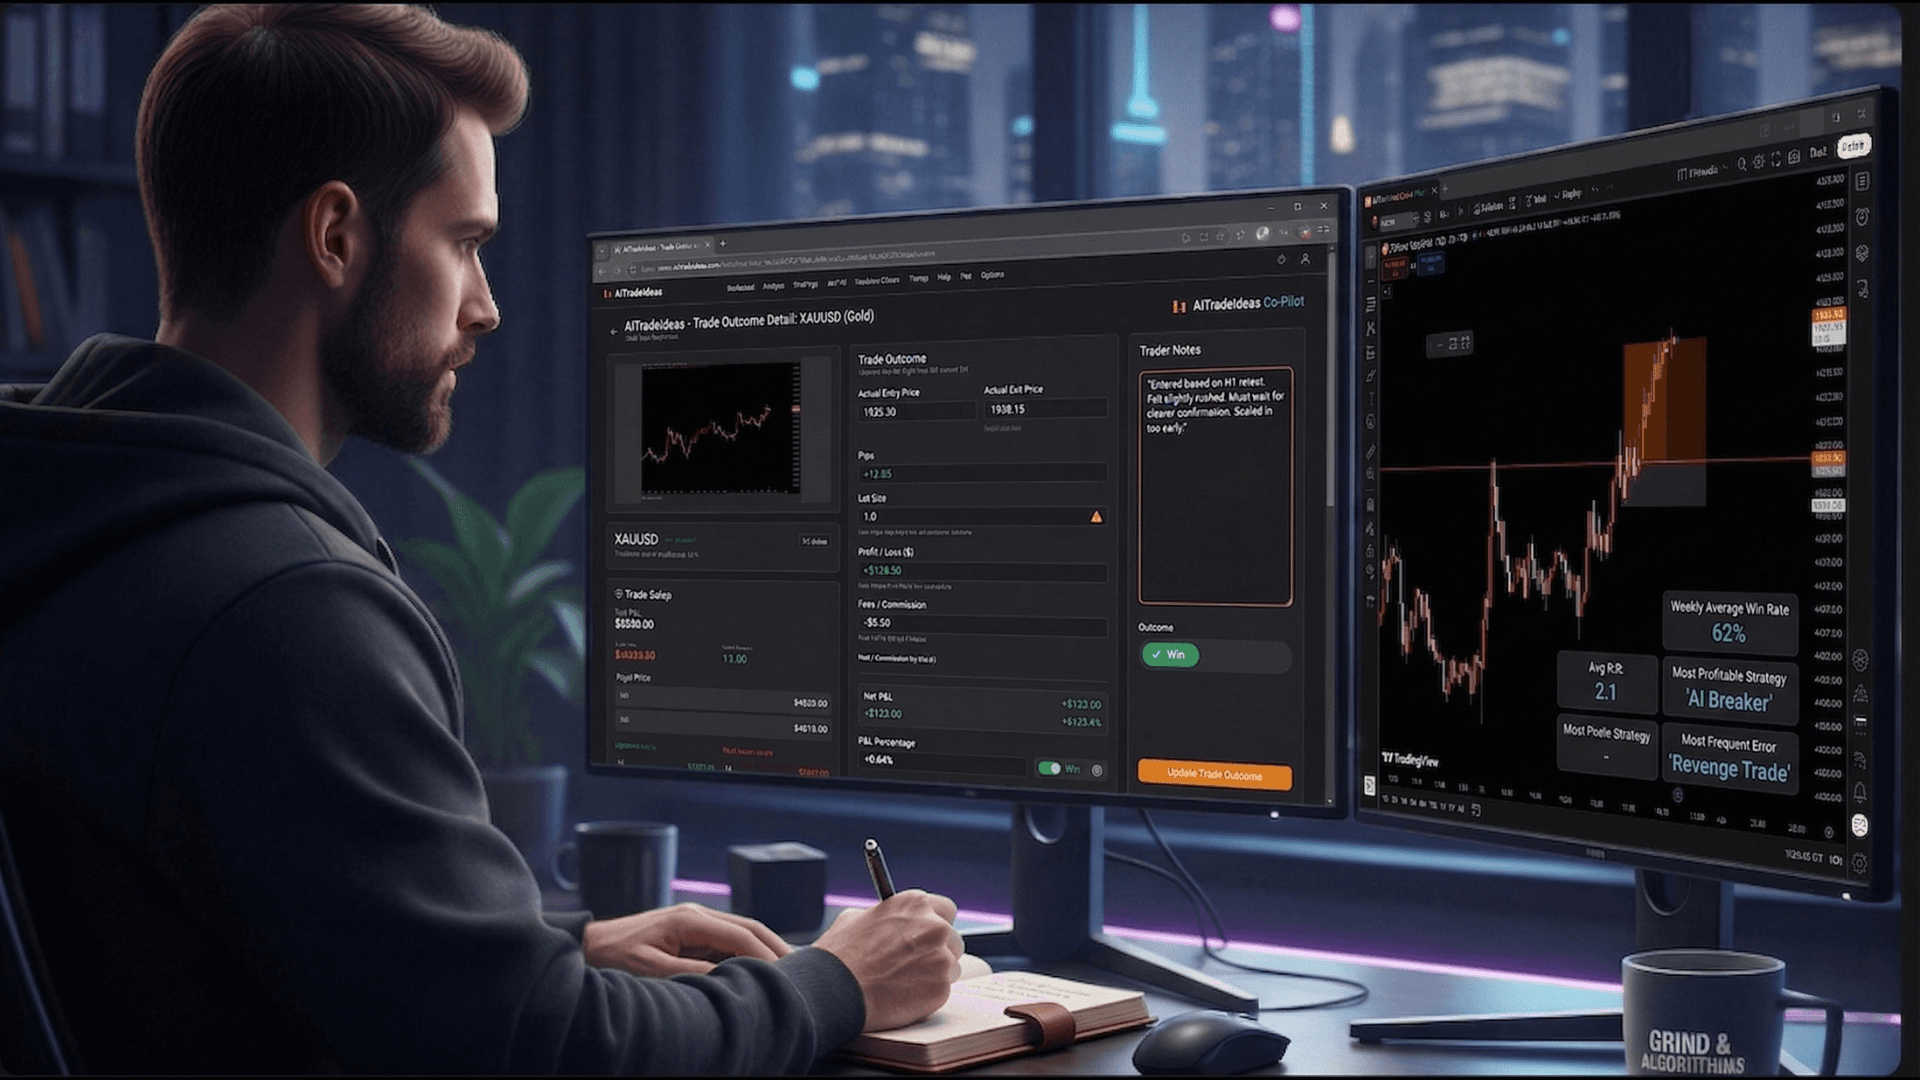
This is where AI-driven models like those at AI Trade Ideas completely change the game. Unlike traditional indicators that simply process past prices, our AI is designed to be reactive, adaptive, and even predictive.
Here’s how AI transcends traditional indicators:
Real-Time Data Streams: Our AI doesn't just look at closing prices. It processes order flow, volume, institutional activity, and intermarket correlations in real-time—often before it even fully reflects on a simple candlestick chart.
Adaptive Learning: Traditional indicators use fixed formulas. An RSI is an RSI. Our AI models, however, are constantly learning and adapting to changing market conditions. Is the market trending or ranging? Is volatility high or low? The AI adjusts its interpretation based on the current environment.
Confluence of Factors: Instead of just one calculation (like RSI's 14-period average), AI combines hundreds, if not thousands, of data points simultaneously. It can spot a subtle shift in DXY impacting Gold, while also noting a volume anomaly on the 5-minute chart of US30, giving you a holistic view no human or simple indicator can provide.
Identifying "Smart Money" Footprints: The AI can detect the subtle maneuvers of institutional players—large orders, liquidity sweeps, and price manipulation that often precede significant moves. These are invisible to a standard MACD.
Your Co-Pilot in the Storm
Think of it this way: traditional indicators are like a basic compass. They point you in a general direction based on where you've been. An AI-driven model is like a modern GPS system—it knows where you are, where you've been, where you're going, traffic conditions, and even potential detours, all in real-time.
By providing signals that are more immediate and informed by a deeper understanding of market dynamics, AI acts as your ultimate Co-Pilot. It helps you anticipate moves rather than just react to them.
Stop Chasing, Start Leading.
It's time to upgrade your trading arsenal. Stop relying solely on tools that always show you yesterday's news. Embrace the future where an intelligent Co-Pilot helps you filter out the noise and seize opportunities as they unfold.